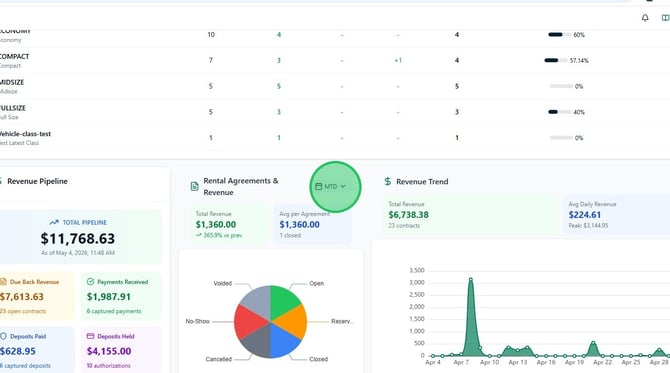
The RentWorks+ Dashboard gives you an at-a-glance view of your fleet, today's pickups and returns, revenue, and anything that needs follow-up — all on one screen. From the dashboard you can also start new reservations or rentals, open any widget as a full report, schedule recurring reports, and customize what you see.
Dashboard navigation
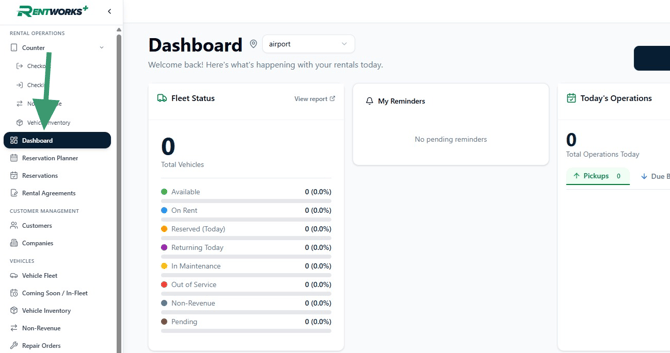
1. From the left-hand menu, click Dashboard.
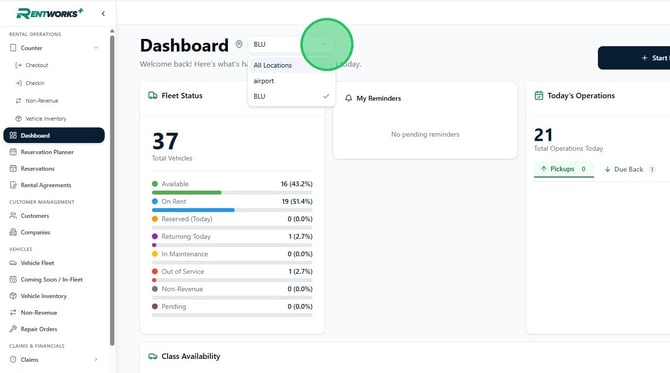
2. Filter the dashboard by location using the location dropdown next to the page title, or select All Locations to see your entire fleet at a glance. The location filter applies to every widget on the page.
3. Click Start Reservation in the top right to begin a new reservation directly from the dashboard.
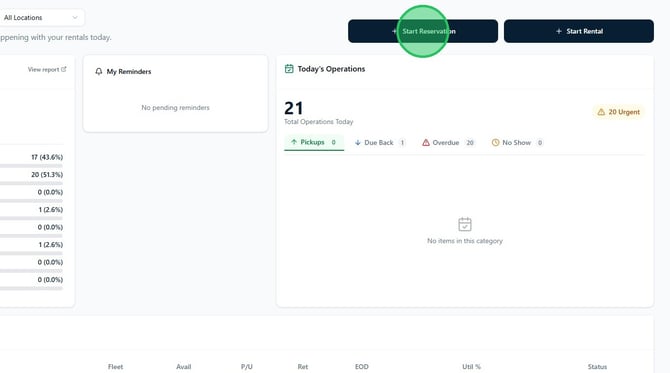
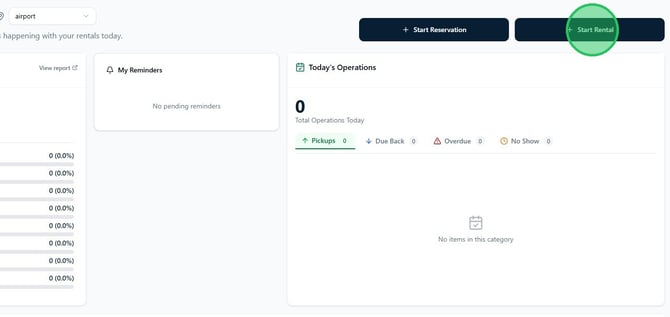
4. Click Start Rental to skip the reservation step and create a new rental agreement on the spot — useful for walk-up customers.
Generating fleet reports
The Fleet Status widget on the dashboard gives you a quick snapshot, but a full report is one click away. Reports can be filtered, customized, exported, and scheduled.
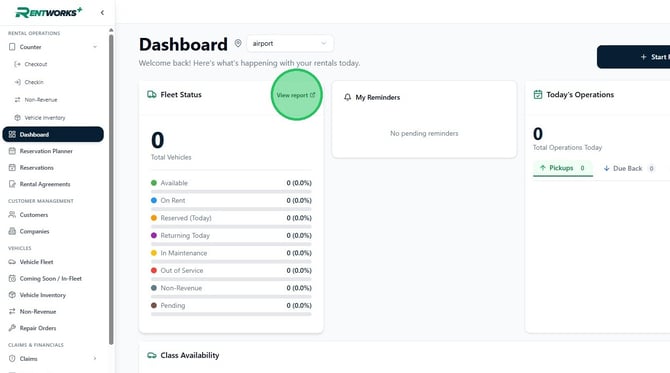
5. In the Fleet Status widget, click View report to open the full Fleet List report.
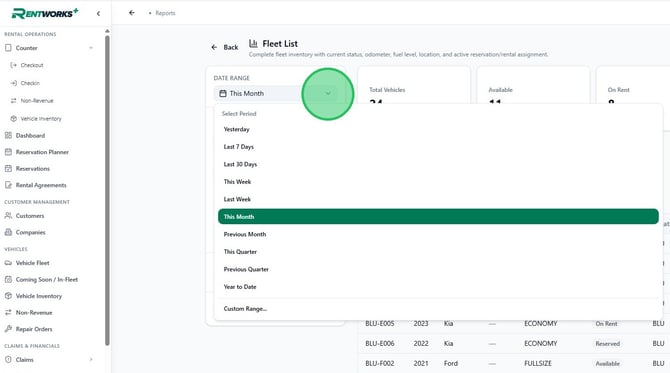
6. Use the Date Range dropdown to set the period you want to analyze. RentWorks+ provides preset options including Yesterday, Last 7 Days, Last 30 Days, This Week, Last Week, This Month, Previous Month, This Quarter, Previous Quarter, and Year to Date. If none of those fit, choose Custom Range to pick your own start and end dates.
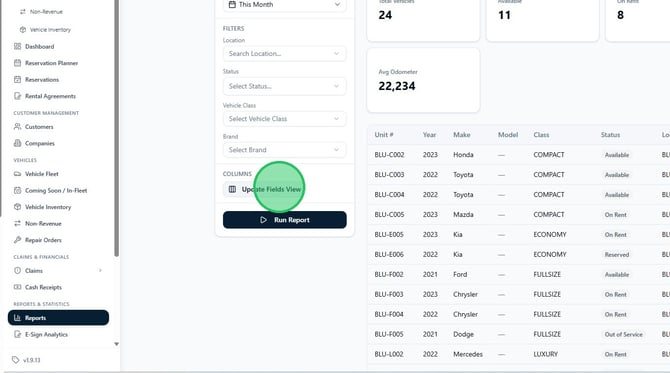
7. Refine the report further with the filters on the left: Location, Status, Vehicle Class, and Brand. Below the filters, the COLUMNS section lets you control which fields appear in the results using Update Fields View. Once your filters and columns are set, click Run Report to refresh the data on screen.
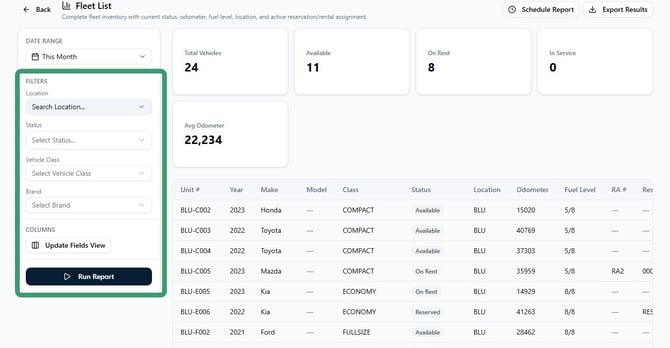
8. To customize the columns in your report, click Update Fields View.
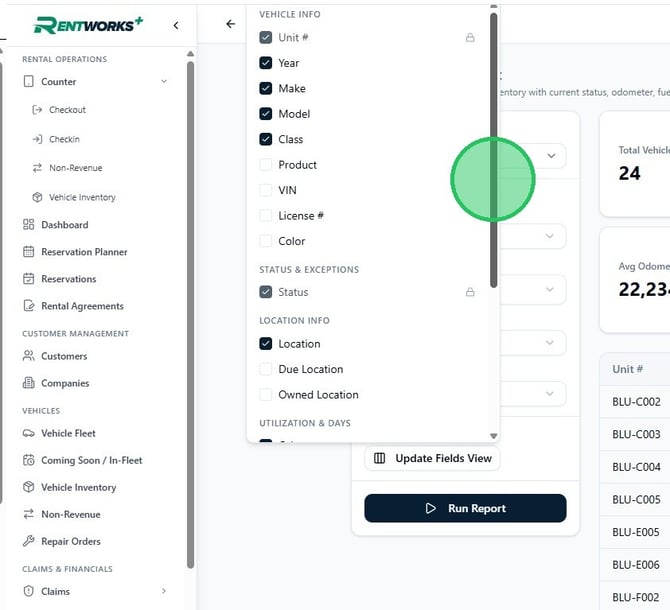
9. The fields panel groups columns by category — Vehicle Info (Unit #, Year, Make, Model, Class, Product, VIN, License #, Color), Status & Exceptions, Location Info, Utilization & Days, and more. Check or uncheck any field to add or remove it from the report. A few core fields (such as Unit # and Status) are required and cannot be removed.
Scheduling automated reports
You can have any report emailed to your team on a recurring schedule, so you don't have to remember to run it manually.
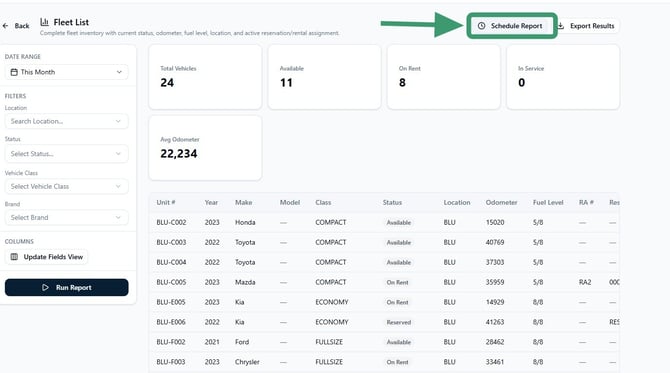
10. With the report you want open, click Schedule Report in the top right.
11. Fill in the schedule details:
- Schedule Name — give the schedule a clear, descriptive name (e.g. Daily Fleet Status — BLU).
- Date Range Preset — the rolling window of data each report run will cover (Last 30 Days, This Week, etc.).
- Frequency — how often the report runs: Daily, Weekly, or Monthly.
- Time — the time of day the report is generated and emailed.
- Export Format — Choose PDF for a formatted report ready to read or print, or CSV if your team needs to work with the data in a spreadsheet.
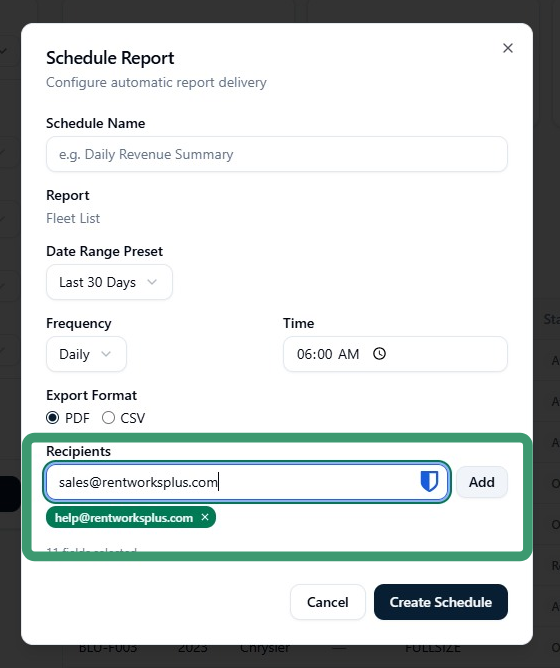
- Recipients — one or more email addresses to receive the report.
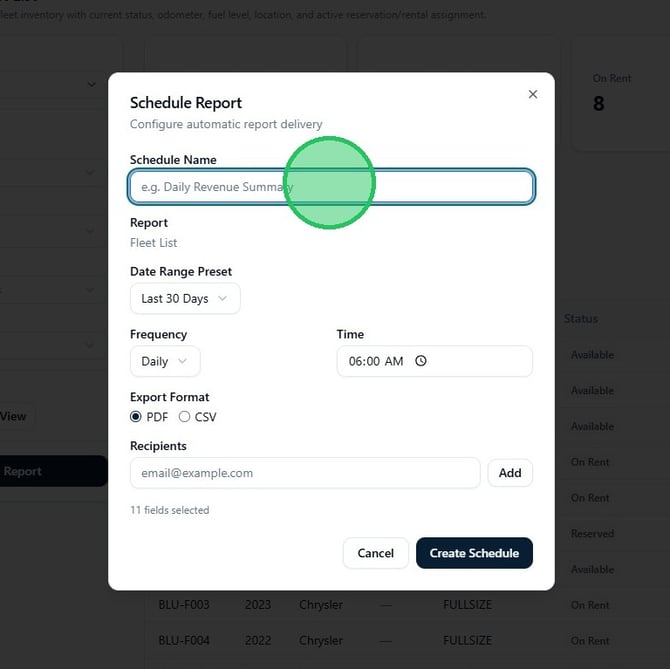
12. In the Recipients field, enter the first email address that should receive the scheduled report and click Add to save that recipient. The address moves into a chip below the field, and you can repeat for as many recipients as you like. Click Create Schedule to save and schedule the report.
Exporting a one-time report
If you don't need a recurring schedule and just want to download the current report, use Export Results instead.
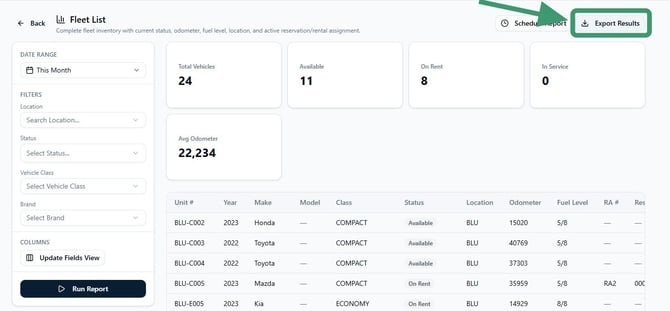
13. Click Export Results in the top right of the report.
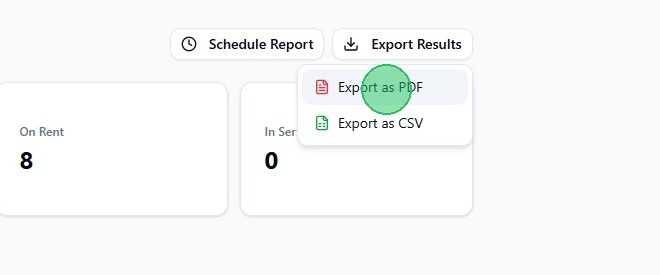
14. Choose Export as PDF or Export as CSV from the dropdown. The file downloads to your computer immediately.
Reading the dashboard widgets
Back on the main dashboard, the widgets give you a real-time view of what's happening today.
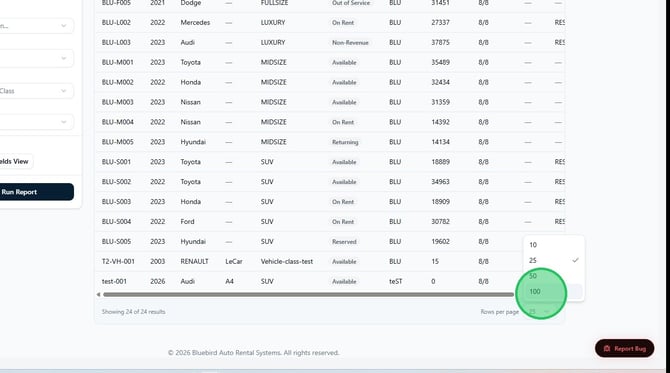
15. The report results table is paginated. Use the Rows per page selector at the bottom right to show 10, 25, 50, or 100 rows at a time. Set it to 100 if you want to see more results without paging.
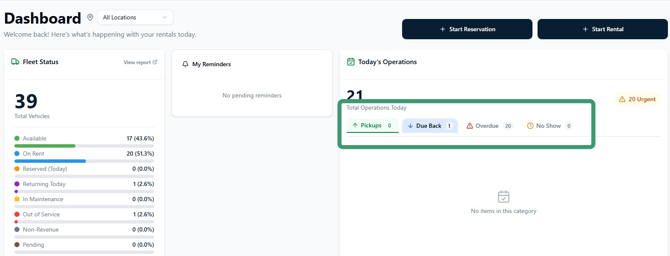
16. The Today's Operations widget shows everything happening today, broken into four tabs: Pickups, Due Back, Overdue and No Show.
17. Scroll further down the dashboard to see additional widgets — Class Availability, Revenue Pipeline, Rental Agreements & Revenue, Revenue Trend, Top Add-ons, Top Revenue Vehicles, Equipment Usage, and Maintenance Alerts. Many of these widgets have a calendar icon (such as MTD) that you can click to adjust the date range — useful for comparing today's numbers against previous periods.